Multiple Choice
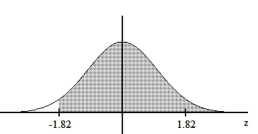
Find the area of the shaded region. The graph depicts the standard normal distribution with mean 0 and standard deviation 1.
-
A)
B) 0.0344
C) 0.4656
D) 0.9656
Correct Answer:

Verified
Correct Answer:
Verified
Related Questions
Q8: Provide an appropriate response.<br>-Under what conditions are
Q147: Estimate the indicated probability by using the
Q148: The serum cholesterol levels for men in
Q149: Assume that X has a normal
Q150: Use the normal distribution to approximate the
Q153: A normal quartile plot is given below
Q154: Scores on a test are normally distributed
Q155: Which of the following is true about
Q156: In a certain population, 11% of people
Q157: Find the area of the shaded region.