Multiple Choice
Find the area of the shaded region. The graph depicts the standard normal distribution with mean 0 and standard deviation 1.
-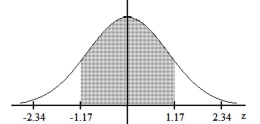
A) 0.8790
B) 0.1210
C) 0.7580
D) 0.2420
Correct Answer:

Verified
Correct Answer:
Verified
Related Questions
Q112: Solve the problem.<br>-For a standard normal distribution,
Q152: Find the area of the shaded
Q153: A normal quartile plot is given below
Q154: Scores on a test are normally distributed
Q155: Which of the following is true about
Q156: In a certain population, 11% of people
Q159: If z is a standard normal
Q160: Three randomly selected households are surveyed as
Q161: Estimate the indicated probability by using the
Q162: Estimate the indicated probability by using