Multiple Choice
The frequency chart shows the distribution of defects for the machines used to produce a product.
A) 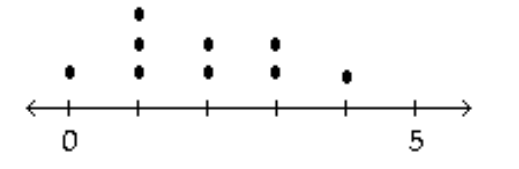
B) 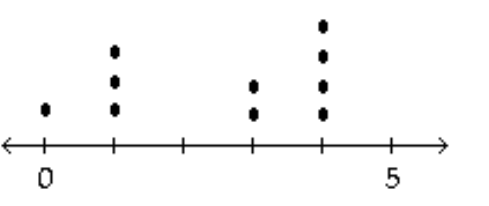
C) 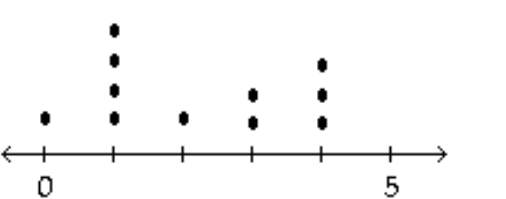
D) 
Correct Answer:

Verified
Correct Answer:
Verified
Related Questions
Q75: Use the given data to construct
Q76: Construct the cumulative frequency distribution that
Q77: An airline checked 7 of its flights
Q78: Construct a pie chart representing the
Q79: A medical research team studied the
Q80: Consider the frequency distribution below, which
Q81: Construct a frequency distribution that includes an
Q82: Wagenlucht Ice Cream Company is always trying
Q83: The frequency distribution below summarizes employee
Q84: The frequency table below shows the