Essay
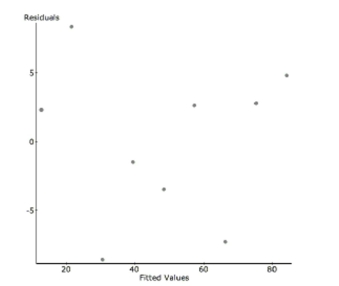
Shrimp From 1982 to 1990, there was a decrease in the number of white shrimp harvested
from the Galveston Bay. Here is the regression analysis and a residual plot. The year has
been shortened to two digits (82, 83…) and the dependent variable is the number of shrimp
collected per hour. Dependent Variable: Shrimp/hour
s:
a. Write the regression equation and define your variables.
b. Find the correlation coefficient and interpret it in context.
c. Interpret the value of the slope in context.
d. In 1991, the shrimp production rebounded (in part due to the effects of El Nino) to 81
shrimp/hour. Find the value of this residual.
e. The prediction for 1991 was very inaccurate. What name do statisticians give to this kind
of prediction error?
Correct Answer:

Verified
a. shrimp/hour  (year)
b. ; This tells u...View Answer
Unlock this answer now
Get Access to more Verified Answers free of charge
Correct Answer:
Verified
b.
View Answer
Unlock this answer now
Get Access to more Verified Answers free of charge
Q1: A study examined the number of
Q7: An article in the Journal of Statistics
Q9: Do you think a linear model is
Q25: A study examined the number of
Q89: Explain the meaning of <span
Q90: A regression equation is found that predicts
Q91: A regression model examining the amount
Q95: During a chemistry lab, students were
Q96: Identify what is wrong with each
Q97: Students A growing school district tracks