Essay
Students A growing school district tracks the student population growth over the years
from 2008 to 2013. Here are the regression results and a residual plot. students year
Sample size: 6
students y
Sample size: 6
R-sq 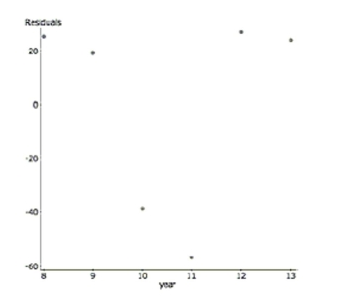
a. Explain why despite a high R-sq, this regression is not a successful model.
To linearize the data, the log (base 10) was taken of the student population. Here are the results.
Dependent Variable: log(students) Sample size: 6
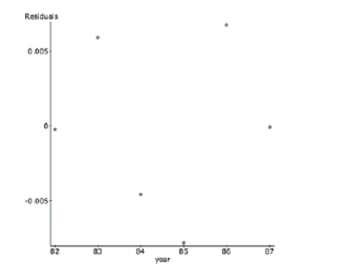
b. Describe the success of the linearization.
c. Interpret R-sq in the context of this problem.
d. Predict the student population in 2014.
Correct Answer:

Verified
a. Even though  , the residual plot has a...
View Answer
Unlock this answer now
Get Access to more Verified Answers free of charge
Correct Answer:
Verified
View Answer
Unlock this answer now
Get Access to more Verified Answers free of charge
Q1: A study examined the number of
Q7: An article in the Journal of Statistics
Q9: Do you think a linear model is
Q25: A study examined the number of
Q94: Shrimp From 1982 to 1990, there
Q95: During a chemistry lab, students were
Q96: Identify what is wrong with each
Q100: Taxi tires A taxi company monitoring
Q101: The following scatterplot shows the relationship
Q102: One your classmates is working on a