Essay
Taxi tires A taxi company monitoring the safety of its cabs kept track of the number of miles tires had been driven (in thousands) and the depth of the tread remaining (in mm). Their data are displayed in the scatterplot. They found the equation of the least squares regression line to be tread miles, with .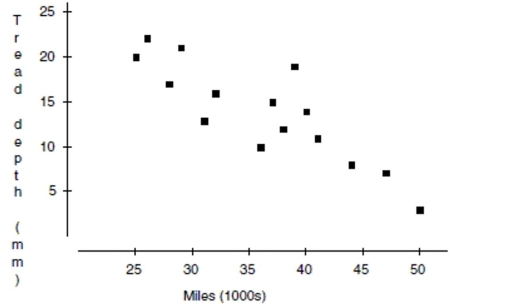
a. Draw the line of best fit on the graph. (Show your method clearly.)
b. What is the explanatory variable?
c. The correlation
d. Describe the association in context.
e. Explain (in context) what the slope of the line means.
f. Explain (in context) what the - intercept of the line means.
g. Explain (in context) what means.
h. In this context, what does a negative residual mean?
Correct Answer:

Verified
averaging 36 mm deep.
g  means that 74% ...
View Answer
Unlock this answer now
Get Access to more Verified Answers free of charge
Correct Answer:
Verified
g
View Answer
Unlock this answer now
Get Access to more Verified Answers free of charge
Q1: A study examined the number of
Q18: A study examined the number of
Q25: A study examined the number of
Q95: During a chemistry lab, students were
Q96: Identify what is wrong with each
Q97: Students A growing school district tracks
Q101: The following scatterplot shows the relationship
Q102: One your classmates is working on a
Q103: A medical researcher finds that the more
Q105: An 8th grade class develops a linear