Essay
The bigger the stop sign, the more expensive it is. Here is a graph of the height of a sign in inches versus its cost in dollars.
To achieve linearity, the data was transformed using a square root function of cost. Here are the results and a residual plot.
Dependent Variable: sqrt(cost)
(correlation coefficient)
s: 0.2141
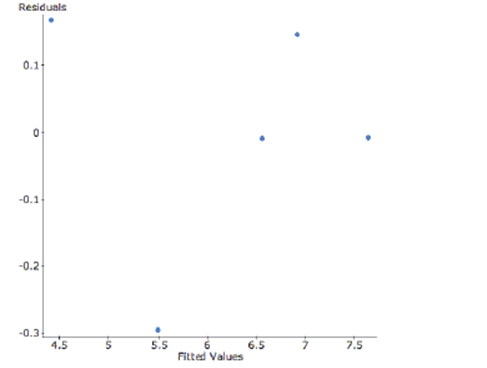
-Do you think this transformation for linearity was successful? Why?
Correct Answer:

Verified
The residual plot has no patte...View Answer
Unlock this answer now
Get Access to more Verified Answers free of charge
Correct Answer:
Verified
View Answer
Unlock this answer now
Get Access to more Verified Answers free of charge
Q16: An article in the Journal of Statistics
Q21: Create a model to predict postal rates
Q77: Here is a scatterplot of weight versus
Q78: The bigger the stop sign, the
Q79: An article in the Journal of
Q80: Height and weight Suppose that both height
Q81: Earning power A college's job placement office
Q83: For families who live in apartments the
Q86: R-sq is a measure of ……<br>A) the
Q87: When using midterm exam scores to predict