Multiple Choice
From the TI-84 graphing calculator screenshots below, choose the screenshot whose shaded area depicts a p-value for a left-tailed test.
A) 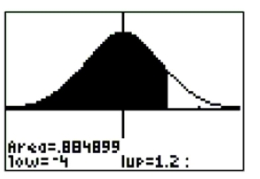
B) 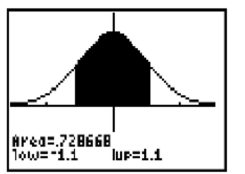
C) 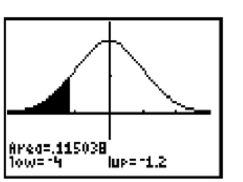
Correct Answer:

Verified
Correct Answer:
Verified
Related Questions
Q20: Which of the following is not one
Q21: A researcher believes that children who
Q22: A sociologist believes that families that
Q24: Complete the statement by filling in the
Q29: Two different students conduct a coin
Q30: Use the following information to answer the
Q30: From the TI-84 graphing calculator screenshots
Q32: List and briefly summarize the essential ingredients
Q45: Which of the following is not true
Q53: Which of the following is not one