Multiple Choice
From the TI-84 graphing calculator screenshots below, choose the screenshot whose shaded area correctly depicts the following hypothesis test results: -value
A) 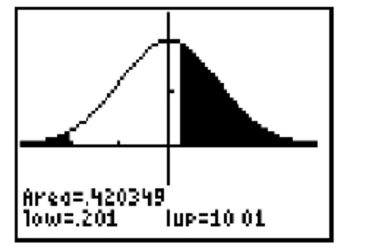
B) 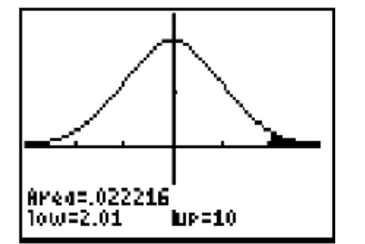
C) 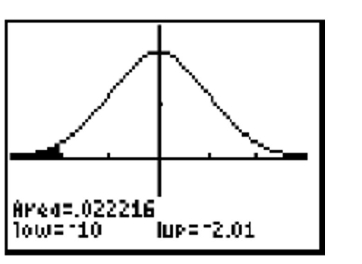
Correct Answer:

Verified
Correct Answer:
Verified
Related Questions
Q20: Which of the following is not one
Q21: List and verify that the conditions hold
Q25: From the TI-84 graphing calculator screenshots below,
Q29: Two different students conduct a coin
Q32: Check that the conditions hold so that
Q34: Suppose the following is to be
Q35: Read the following problem description then
Q41: Use the following information to answer the
Q45: Which of the following is not true
Q53: Which of the following is not one