Essay
The scatterplot below shows the number of alcoholic drinks consumed and memory testresults for some college students. Is there an association?
If so, describe the pattern. Be sureto comment on trend, shape, and the strength of the association.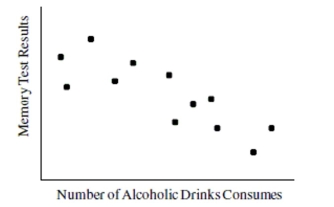
Correct Answer:

Verified
Consuming more alcoholic drink...View Answer
Unlock this answer now
Get Access to more Verified Answers free of charge
Correct Answer:
Verified
View Answer
Unlock this answer now
Get Access to more Verified Answers free of charge
Q5: The following calculator screenshots show the scatterplot
Q7: The following regression equation was found to
Q8: The scatterplot below shows the hat size
Q9: The data in the table represent
Q11: The scatterplot below shows the ice cream
Q12: The following regression equation was found to
Q13: It is determined that a positive
Q15: A horticulturist conducted an experiment on
Q36: Use the following information to answer the
Q42: Use the following information to answer the