Multiple Choice
The following calculator screenshots show the scatterplot and the correlation coefficient between car weight and car length for a sample of 2009 model year cars. 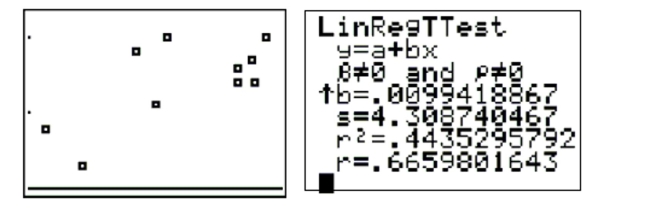 The relationship between "car length" and "car weight" can be described as
A) A weak negative relationship
B) A strong positive linear relationship
C) A moderate positive linear relationship
D) A strong negative linear relationship
Correct Answer:

Verified
Correct Answer:
Verified
Q2: Use the following information to answer the
Q2: Based on the scatterplots below, what is
Q4: The table shows the number of
Q7: The following regression equation was found to
Q8: The scatterplot below shows the hat size
Q9: The data in the table represent
Q10: The scatterplot below shows the number of
Q11: The scatterplot below shows the ice cream
Q33: Which of the following statements regarding the
Q36: Use the following information to answer the