Essay
The figures below show the relationship between salary and personal lunch expenses onweek days for a group of business men. Comment on the difference in graphs and in thecoefficient of determination between the graph that includes a data point of someone whoreported earnings of $21,000 per year and weekly personal lunch expenses of $100 perweek (second graph) and the graph that did not include this data point (first graph). 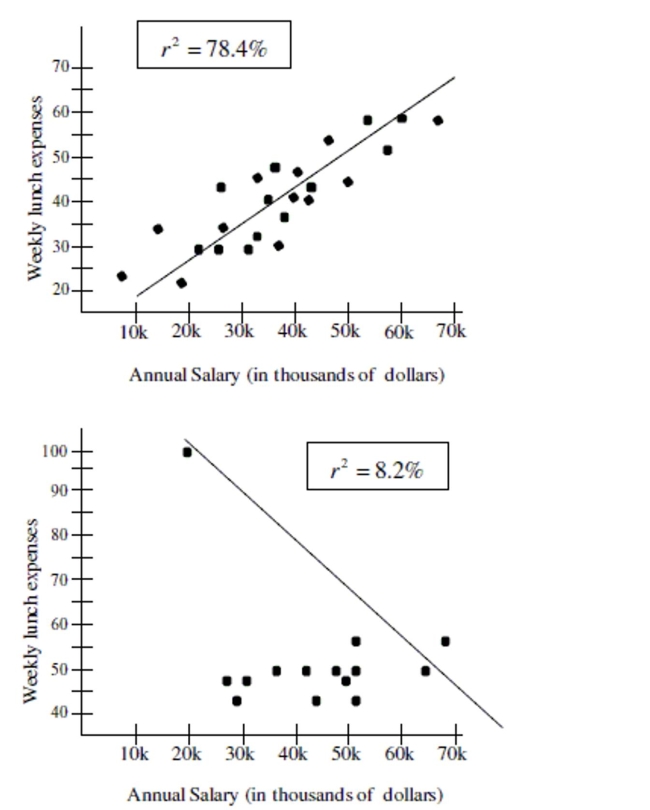
Correct Answer:

Verified
The coefficient of determinati...View Answer
Unlock this answer now
Get Access to more Verified Answers free of charge
Correct Answer:
Verified
View Answer
Unlock this answer now
Get Access to more Verified Answers free of charge
Q11: Use the data provided in the table
Q28: Suppose that runner height (in inches)and finish
Q48: The table shows the number of
Q50: A concert ticket agent is going to
Q51: The scatterplot below shows the number of
Q53: A horticulturist conducted an experiment on 110
Q54: It is determined that a positive linear
Q55: Choose the scatterplot that matches the
Q56: A veterinarian is going to investigate whether
Q57: Suppose it has been established that