Multiple Choice
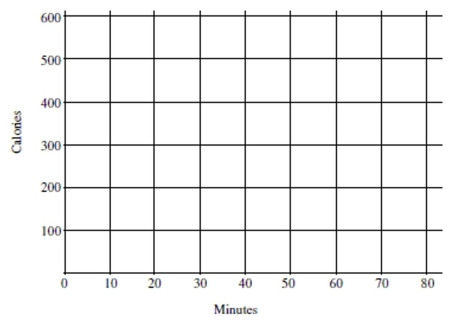
The table shows the number of minutes ridden on a stationary bike and the approximate number of calories burned. Plot the points on the grid provided then choose the most likely co relationCoefficient from the answer choices below.
A)
B)
C)
D)
Correct Answer:

Verified
Correct Answer:
Verified
Related Questions
Q11: Use the data provided in the table
Q28: Suppose that runner height (in inches)and finish
Q34: Which of the following statements regarding the
Q45: Choose the scatterplot that matches the
Q46: Choose the scatterplot that matches the
Q50: A concert ticket agent is going to
Q51: The scatterplot below shows the number of
Q52: Use the data provided in the table
Q52: The figures below show the relationship between
Q53: A horticulturist conducted an experiment on 110