Multiple Choice
Data were collected on hand grip strength of adults. The histogram below summarizes the data. Which statement is true about the distribution of the data shown in the graph? 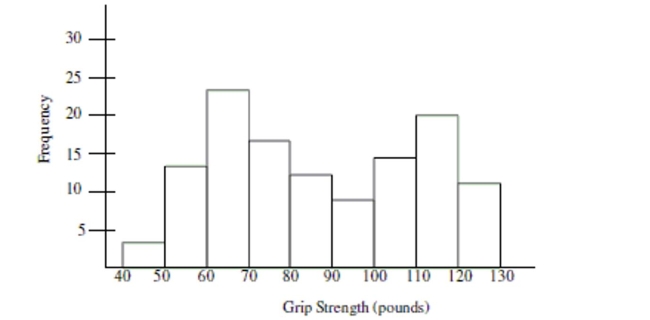
A) There must have been a mistake made in data collection because the distribution should be Bell-shaped.
B) The graph shows evidence that two different groups may have been combined into one Collection.
C) The best estimate of typical grip strength is 80-90 pounds because it is in the center of the Distribution.
D) The graph is useless because it is bimodal.
Correct Answer:

Verified
Correct Answer:
Verified
Q19: Choose the histogram that matches the description.<br>-The
Q20: A used car salesman decides to track
Q22: Each day for twenty days a record
Q23: According to the histogram, about how many
Q26: Based on the histogram below, would it
Q28: The distribution of test scores for a
Q35: Which category shows the least amount of
Q56: What is the approximate percentage of participants
Q57: Data was collected on the heights of
Q58: How many participants had a heart rate