Essay
A used car salesman decides to track the number of cars he sold each week for the past twelve months. Typically, the salesman sells 13 cars per week. During an usually slowweek he sold only 2 cars, but during his best week he sold 29 cars. Predict the shape of thehistogram of the number of cars sold each week. 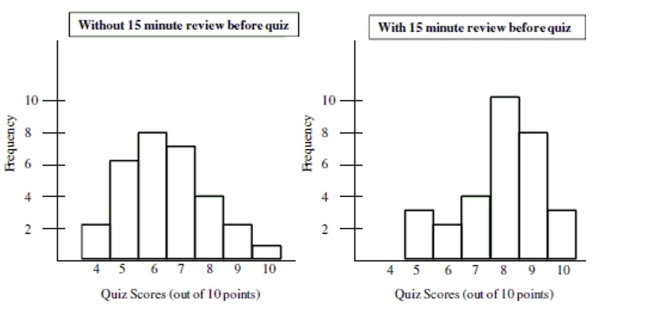
Correct Answer:

Verified
Without the 15 minute review the distrib...View Answer
Unlock this answer now
Get Access to more Verified Answers free of charge
Correct Answer:
Verified
View Answer
Unlock this answer now
Get Access to more Verified Answers free of charge
Q8: Compare and contrast the important similarities and
Q15: The distribution of the numbers of times
Q16: Choose the histogram that matches the description.<br>-The
Q19: Choose the histogram that matches the description.<br>-The
Q22: Each day for twenty days a record
Q23: According to the histogram, about how many
Q24: Data were collected on hand grip strength
Q32: About what percentage of households own no
Q56: What is the approximate percentage of participants
Q58: How many participants had a heart rate