Essay
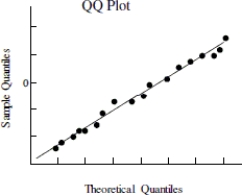
Use the following information to answer the question. Below is the scatterplot showing the association between the number of workers on an assembly team (x), and the number of parts assembled in an 8- hour shift (y). The residual plot of the data is also shown along with a QQ plot of the residuals.
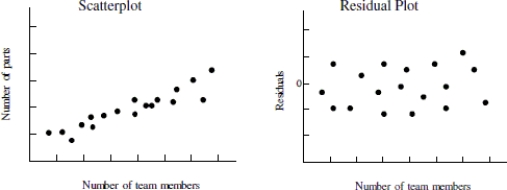
-Use the plot(s)above to explain whether the condition for constant standard deviation is satisfied.
Correct Answer:

Verified
The residual plot does not hav...View Answer
Unlock this answer now
Get Access to more Verified Answers free of charge
Correct Answer:
Verified
View Answer
Unlock this answer now
Get Access to more Verified Answers free of charge
Q29: The regression output below is the result
Q30: Use the following information to answer the
Q31: Explain what residuals are. Where do residuals
Q32: Environmental biologists studying the relationship between the
Q33: Use the following information to answer the
Q35: Use the following information to answer the
Q36: Which of the following is not a
Q37: Use the following information to answer the
Q38: Use the following information to answer the
Q39: Use the following information to answer the