Short Answer
The graph in the figure shows the position of a particle as a function of time as it travels
along the x-axis.
(a) What is the magnitude of the average velocity of the particle between t = 1.0 s and t =
4.0 s?
(b) What is the average speed of the particle between t = 1.0 s and t = 4.0 s? 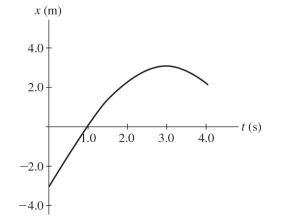
Correct Answer:

Verified
(a) 0.67 m...View Answer
Unlock this answer now
Get Access to more Verified Answers free of charge
Correct Answer:
Verified
View Answer
Unlock this answer now
Get Access to more Verified Answers free of charge
Q284: Electrically neutral objects cannot exert an electrical
Q285: As a proton moves in a direction
Q286: At a distance of 15.0 m from
Q287: The lowest tone to resonate in a
Q288: A negatively-charged plastic rod is brought close
Q290: Abby throws a ball straight up and
Q291: The position of an object that is
Q292: A ball is thrown straight up with
Q293: The figure shows a graph of the
Q294: You are driving along a highway at