Short Answer
The figure shows a graph of the velocity of an object as a function of time. What is the
average acceleration of the object over the following time intervals?
(a) From t = 0 s to t = 5.0 s
(b) From t = 0 s to t = 8.0 s 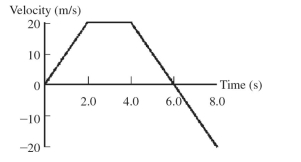
Correct Answer:

Verified
(a) 2.0 m/...View Answer
Unlock this answer now
Get Access to more Verified Answers free of charge
Correct Answer:
Verified
View Answer
Unlock this answer now
Get Access to more Verified Answers free of charge
Q288: A negatively-charged plastic rod is brought close
Q289: The graph in the figure shows the
Q290: Abby throws a ball straight up and
Q291: The position of an object that is
Q292: A ball is thrown straight up with
Q294: You are driving along a highway at
Q295: A bat emits a sound at a
Q296: An electronic component with a <img src="https://d2lvgg3v3hfg70.cloudfront.net/TB3818/.jpg"
Q297: An astronaut on a strange new planet
Q298: If you are driving 72 km/h along