Multiple Choice
The figure shows a diagram for an ideal gas that is carried around a cyclic process. How much work is done in one cycle if and ? 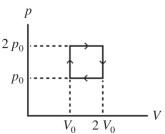
A)
B)
C)
D)
E)
Correct Answer:

Verified
Correct Answer:
Verified
Related Questions
Q53: A heat engine absorbs 85.6 kJ of
Q54: When water at <span class="ql-formula"
Q55: The temperature of an ideal gas
Q56: The process shown on the
Q57: Two processes are shown on the
Q59: A heat engine receives <span
Q60: The figure shows a <span
Q61: If the efficiency of a Carnot
Q62: The figure shows a <span
Q63: A 40.0-L container is divided into