Short Answer
The figure shows a diagram for a gas going through a cycle from to to and back to A. From point to point , the gas absorbs of heat and finds its internal (thermal) energy has increased by . Going from B to , the internal (thermal) energy decreases by .
(a) How much work was done by the gas from to ?
(b) How much heat was absorbed by the gas from to ?
(c) How much work was done by the gas going from to ?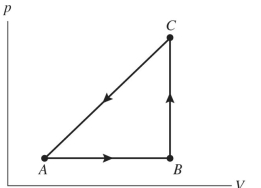
Correct Answer:

Verified
(a) 
(b) ...View Answer
Unlock this answer now
Get Access to more Verified Answers free of charge
Correct Answer:
Verified
(b)
View Answer
Unlock this answer now
Get Access to more Verified Answers free of charge
Q32: The figure shows a <span
Q33: For a certain ideal Carnot engine,
Q34: An ideal gas undergoes the process
Q35: Two ideal Carnot heat engines have
Q36: A compression at a constant pressure
Q38: A certain automobile engine takes in 4.00
Q39: A Carnot cycle consists of<br>A) four isotherms.<br>B)
Q40: A Carnot engine operates between two
Q41: An ideal Carnot refrigerator with a
Q42: An ideal Carnot engine operating between