Multiple Choice
The figure shows a graph of the velocity v as a function of time t for a system undergoing simple harmonic motion. Which one of the following graphs represents the acceleration of this system as a Function of time? 
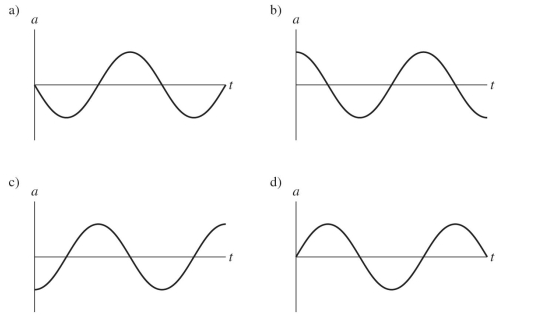
A) graph a
B) graph b
C) graph c
D) graph d
Correct Answer:

Verified
Correct Answer:
Verified
Related Questions
Q73: A 2.0 kg box is
Q74: Find the first three harmonics of a
Q75: If the frequency of a violin string
Q76: If the frequency of a system undergoing
Q77: If a wave has a speed of
Q79: The intensity of the waves from a
Q80: A pendulum that was originally erected by
Q81: A 0.250-kg stone is attached
Q82: A 0.50-kg box is attached to an
Q83: Which one of the curves shown in