Multiple Choice
Which one of the curves shown in the figure best represents the variation of wave speed v as a function of tension for transverse waves on a stretched string? 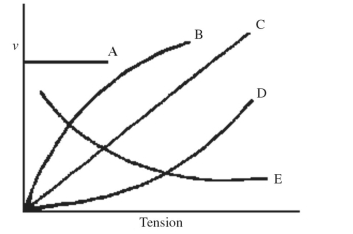
A) A
B) B
C) C
D) D
E) E
Correct Answer:

Verified
Correct Answer:
Verified
Related Questions
Q78: The figure shows a graph of the
Q79: The intensity of the waves from a
Q80: A pendulum that was originally erected by
Q81: A 0.250-kg stone is attached
Q82: A 0.50-kg box is attached to an
Q84: The position of an object that is
Q85: A 4.0-g string is 0.36
Q86: A sewing machine needle moves up and
Q87: The position of an object that is
Q88: A ball is attached to an ideal