Multiple Choice
Use the circle graph to solve the problem.
-The pie chart below gives the inventory of the men's department of a store. 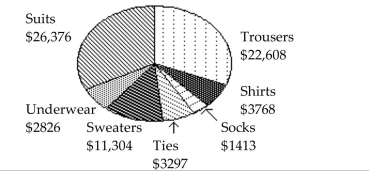 In which item of apparel does the store have the smallest investment?
A) Socks
B) Underwear
C) Shirts
D) Suits
Correct Answer:

Verified
Correct Answer:
Verified
Q49: Solve the problem.<br>-The Kappa Iota Sigma Fraternity
Q50: Find the original data from the
Q51: Find the original data from the
Q52: Provide an appropriate response.<br>-Histograms and Pareto charts
Q53: Solve the problem.<br>-Using the employment information
Q55: Solve the problem.<br>-Using the information in
Q56: Solve the problem.<br>-Using the information in
Q57: Construct the dot plot for the
Q58: Provide an appropriate response.<br>-Create an example displaying
Q66: Explain the difference between a frequency distribution