Multiple Choice
Construct the dot plot for the given data.
-The frequency chart shows the distribution of defects for the machines used to produce a product.
A) 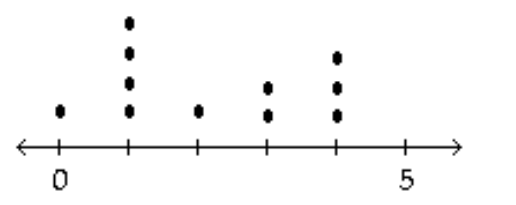
B) 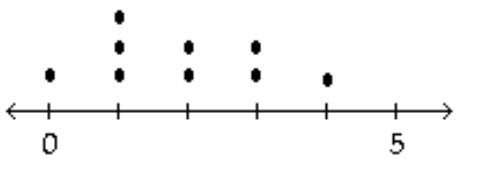
C) 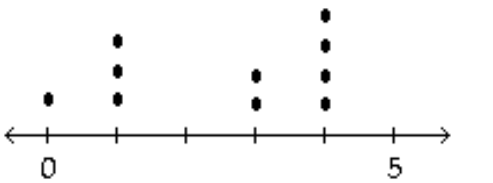
D) 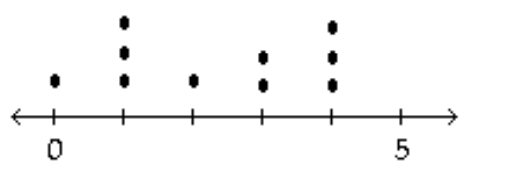
Correct Answer:

Verified
Correct Answer:
Verified
Related Questions
Q52: Provide an appropriate response.<br>-Histograms and Pareto charts
Q53: Solve the problem.<br>-Using the employment information
Q54: Use the circle graph to solve the
Q55: Solve the problem.<br>-Using the information in
Q56: Solve the problem.<br>-Using the information in
Q58: Provide an appropriate response.<br>-Create an example displaying
Q60: Construct a pie chart representing the
Q61: Find the original data from the
Q62: Use the circle graph to solve the
Q66: Explain the difference between a frequency distribution