Multiple Choice
Use the data to create a stemplot.
-A car dealer is deciding what kinds of vehicles he should order from the factory. He looks at his sales report for the preceding period. Choose the vertical scale so that the relative frequencies are represented.
Construct a Pareto chart to help him decide.
A) 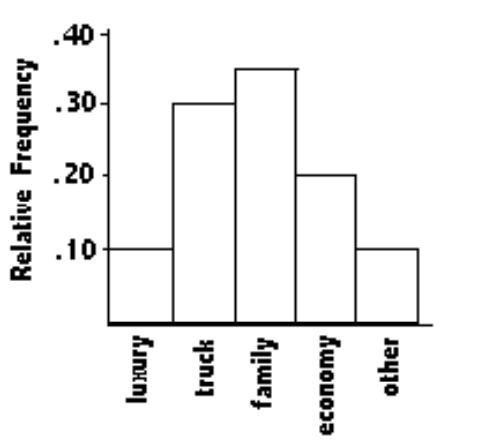
B) 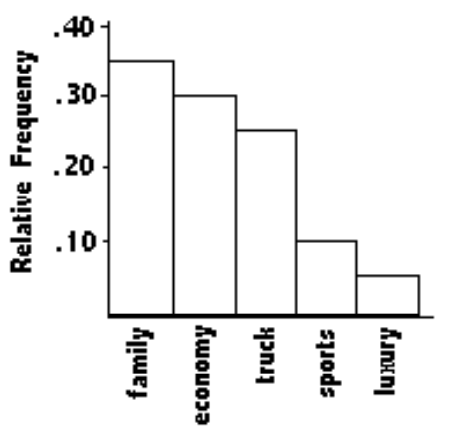
C) 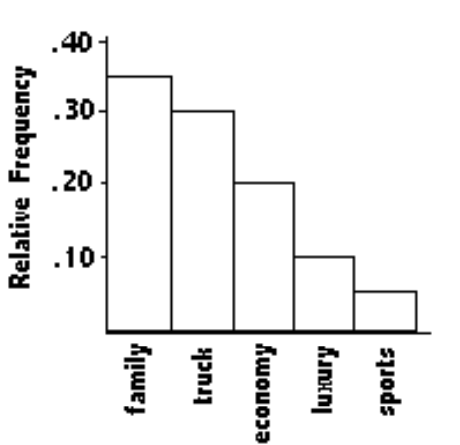
D) 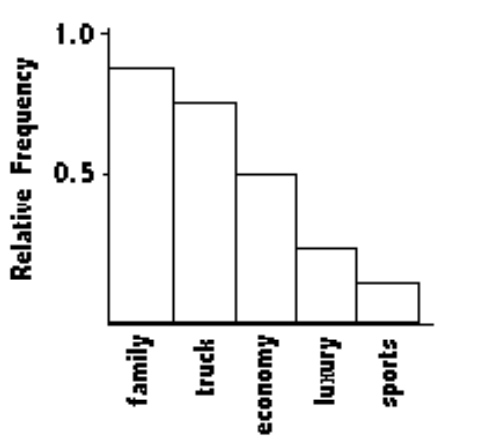
Correct Answer:

Verified
Correct Answer:
Verified
Q22: Solve the problem.<br>-Suppose that a histogram
Q23: Construct the dot plot for the
Q24: Construct the dot plot for the
Q25: Find the original data from the
Q26: Construct a pie chart representing the
Q28: Solve the problem.<br>-The following frequency distribution
Q29: Construct a pie chart representing the
Q30: Solve the problem.<br>-The data shows the
Q31: Construct the relative frequency distribution that
Q32: Solve the problem.<br>-Using the employment information