Multiple Choice
Construct a pie chart representing the given data set.
-The following figures give the distribution of land (in acres) for a county containing 82,000 acres. 
A) 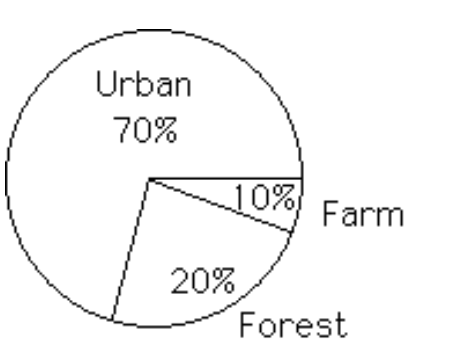
B) 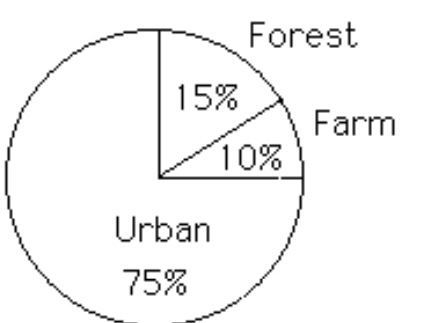
Correct Answer:

Verified
Correct Answer:
Verified
Related Questions
Q21: Use the circle graph to solve the
Q22: Solve the problem.<br>-Suppose that a histogram
Q23: Construct the dot plot for the
Q24: Construct the dot plot for the
Q25: Find the original data from the
Q27: Use the data to create a
Q28: Solve the problem.<br>-The following frequency distribution
Q29: Construct a pie chart representing the
Q30: Solve the problem.<br>-The data shows the
Q31: Construct the relative frequency distribution that