Multiple Choice
Construct a pie chart representing the given data set.
- 
A) 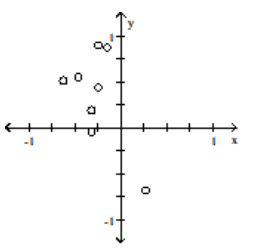
B) 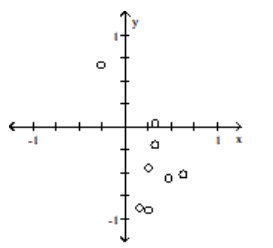
C) 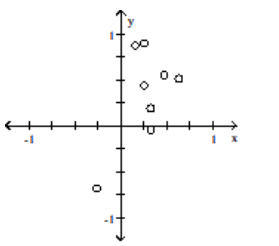
D) 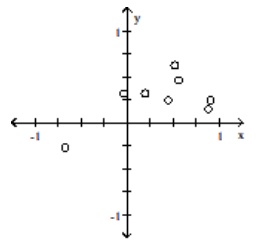
Correct Answer:

Verified
Correct Answer:
Verified
Related Questions
Q72: Solve the problem.<br>-The following frequency distribution
Q73: Solve the problem.<br>-The frequency table below
Q74: Construct the dot plot for the
Q75: Use the given data to construct
Q76: Construct the cumulative frequency distribution that
Q77: Solve the problem.<br>-In a survey, 20
Q78: Solve the problem.<br>-Consider the frequency distribution
Q79: Construct the relative frequency distribution that
Q80: Use the data to create a
Q81: Solve the problem.<br>-The following frequency distribution