Essay
Use the given process data to construct a control chart for p
-A control chart for is shown below. Determine whether the process mean is within statistical control. If it is not, identify which of the three out-of-control criteria lead to rejection of a statistically stable mean. 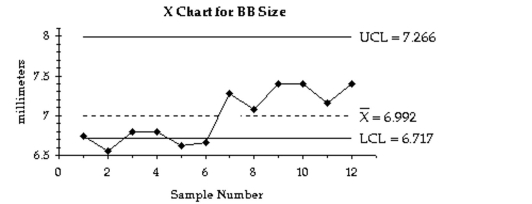
Correct Answer:

Verified
Process mean is not within sta...View Answer
Unlock this answer now
Get Access to more Verified Answers free of charge
Correct Answer:
Verified
View Answer
Unlock this answer now
Get Access to more Verified Answers free of charge
Q4: Use the given process data to
Q5: Use the given process data to
Q6: Use the given process data to construct
Q7: Solve the Problem.<br>-An <span class="ql-formula"
Q8: Use the given process data to
Q10: Use the given process data to construct
Q11: Solve the Problem.<br>-A control chart for attributes
Q12: Use the given process data to construct
Q14: Use the given process data to
Q32: Define statistically stable (or "within statistical control").