Essay
Use the given process data to construct a control chart for p
-A run chart for individual values is shown below. Does there appear to be a pattern suggesting that the process is not within statistical control? If so, describe the pattern. 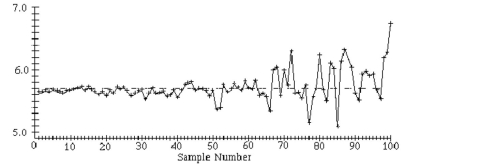
Correct Answer:

Verified
Process appears to b...View Answer
Unlock this answer now
Get Access to more Verified Answers free of charge
Correct Answer:
Verified
View Answer
Unlock this answer now
Get Access to more Verified Answers free of charge
Q1: Use the given process data to
Q2: A machine that is supposed to
Q3: Solve the Problem.<br>-A control chart for
Q4: Use the given process data to
Q5: Use the given process data to
Q7: Solve the Problem.<br>-An <span class="ql-formula"
Q8: Use the given process data to
Q9: Use the given process data to
Q10: Use the given process data to construct
Q11: Solve the Problem.<br>-A control chart for attributes