Essay
Use the given process data to construct a control chart for p
-A control chart for R is shown below. Determine whether the process variation is within statistical control. If it is not, identify which of the three out-of-control criteria lead to rejection of statistically stable variation. 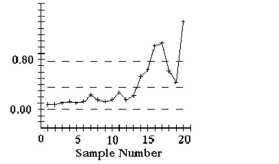
Correct Answer:

Verified
Process variation appears to be out of s...View Answer
Unlock this answer now
Get Access to more Verified Answers free of charge
Correct Answer:
Verified
View Answer
Unlock this answer now
Get Access to more Verified Answers free of charge
Q28: Use the given process data to construct
Q29: Use the given process data to
Q30: Use the given process data to
Q31: Use the given process data to
Q33: A machine is supposed to fill
Q34: Use the given process data to
Q35: Use the given process data to construct
Q36: Use the given process data to construct
Q37: Use the given process data to
Q52: Describe a run chart and give an