Essay
A control chart for is shown below. Determine whether the process mean is within statistical control. If it is not, identify which of the three out-of-control criteria lead to rejection of a statistically stable mean.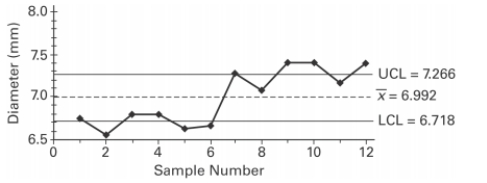
Correct Answer:

Verified
Correct Answer:
Verified
Related Questions
Q1: Use the given process data to
Q2: There_ between two factors if the effect
Q2: Explain what an efficiency rating is. You
Q4: Examine the given run chart or control
Q7: Use the data in the given
Q8: Use the Wilcoxon rank-sum test to
Q9: Fill in the missing entries in
Q13: Describe an R chart and give an
Q46: Describe the three criteria used to determine
Q46: Describe the three criteria used to determine