Essay
Examine the given run chart or control chart and determine whether the process is within
statistical control. If it is not, identity which of the three out-of-statistical-control criteria
apply. A run chart for individual values W is shown below. Does there appear to be a pattern
suggesting that the process is not within statistical control? If so, describe the pattern. 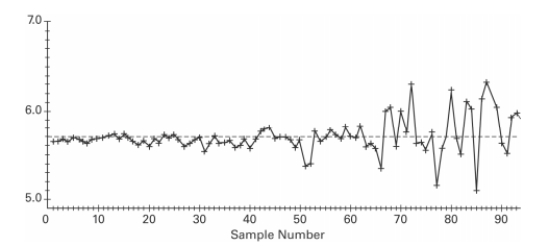
Correct Answer:

Verified
The process appears ...View Answer
Unlock this answer now
Get Access to more Verified Answers free of charge
Correct Answer:
Verified
View Answer
Unlock this answer now
Get Access to more Verified Answers free of charge
Q1: Use the given process data to
Q2: There_ between two factors if the effect
Q2: Explain what an efficiency rating is. You
Q3: A control chart for <span
Q7: Use the data in the given
Q8: Use the Wilcoxon rank-sum test to
Q9: Fill in the missing entries in
Q13: Describe an R chart and give an
Q46: Describe the three criteria used to determine
Q46: Describe the three criteria used to determine