Multiple Choice
Find the area of the shaded region. The graph depicts the standard normal distribution wit? mean 0 and standard deviation 1. 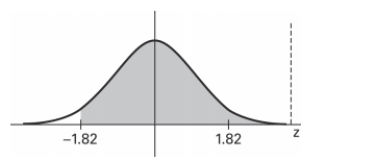
A)
B)
C)
D)
Correct Answer:

Verified
Correct Answer:
Verified
Related Questions
Q7: The heights of adult females are normally
Q9: Scores on a test have a
Q11: <span class="ql-formula" data-value="\text { If } z
Q12: Define a density curve and describe the
Q15: A normal quartile plot is given below
Q16: The distribution of certain test scores
Q17: You will use a normal distribution
Q29: Heights of adult females are normally distributed.
Q53: Identify three important criteria to determine if
Q55: The continuity correction is used to compensate