Essay
A normal quartile plot is given below for a sample of scores on an aptitude test. Use the
plot to assess the normality of scores on this test. Explain your reasoning. 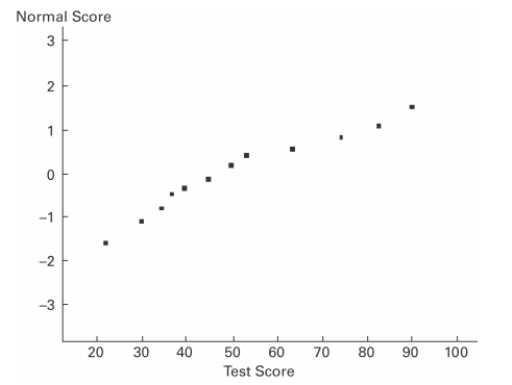
Correct Answer:

Verified
Since the normal quartile plot...View Answer
Unlock this answer now
Get Access to more Verified Answers free of charge
Correct Answer:
Verified
Since the normal quartile plot...
View Answer
Unlock this answer now
Get Access to more Verified Answers free of charge
Related Questions
Q11: <span class="ql-formula" data-value="\text { If } z
Q12: Find the area of the shaded
Q12: Define a density curve and describe the
Q16: The distribution of certain test scores
Q17: You will use a normal distribution
Q18: If <span class="ql-formula" data-value="z"><span class="katex"><span
Q19: Scores on a test are normally
Q20: If a sample size is <_ ,
Q53: Identify three important criteria to determine if
Q55: The continuity correction is used to compensate