Multiple Choice
The scatter diagram shows the relationship between average number of years of education and births per woman ofchild bearing age in selected countries. Use the scatter plot to determine whether the statement is true or false.
-There is a causal relationship between years of education and births per woman. 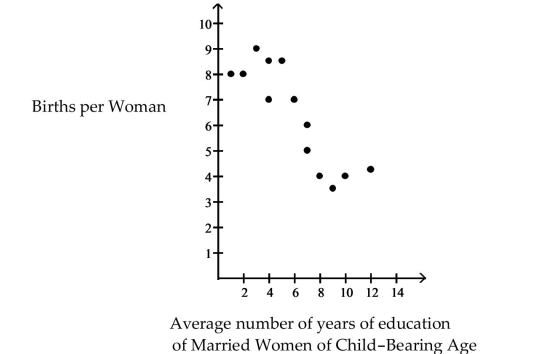
A) False
B) True
Correct Answer:

Verified
Correct Answer:
Verified
Q33: Choose the one alternative that best
Q35: Choose the one alternative that best
Q36: Interpret the Slope and the y-intercept
Q38: For a random sample of 100 American
Q38: Compute the linear correlation coefficient between
Q39: Compute the linear correlation coefficient between
Q40: Change the exponential expression to an
Q41: Choose the one alternative that best
Q42: Provide an appropriate response.<br>-The following data
Q60: A researcher determines that the linear correlation