Multiple Choice
Choose the one alternative that best completes the statement or answers the question.
Make a scatter diagram for the data. Use the scatter diagram to describe how, if at all, the variables are related.
- 
A) 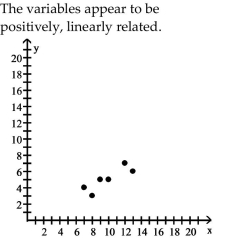
B) 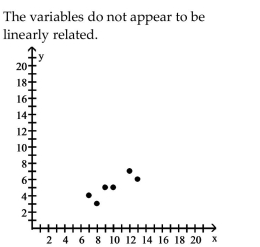
C) 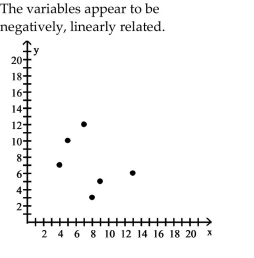
D) 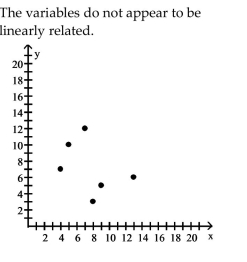
Correct Answer:

Verified
Correct Answer:
Verified
Q30: Compute the Sum of Squared Residuals<br>-The
Q31: Provide an appropriate response.<br>-A company encourages
Q33: Choose the one alternative that best
Q36: Interpret the Slope and the y-intercept
Q37: The scatter diagram shows the relationship between
Q38: For a random sample of 100 American
Q38: Compute the linear correlation coefficient between
Q39: Compute the linear correlation coefficient between
Q40: Change the exponential expression to an
Q60: A researcher determines that the linear correlation