Essay
Provide an appropriate response.
-A company encourages applications from minority groups who they feel are under-represented in the company. The table shows the number of applications that were accepted last year from people belonging to minority groups and the number of applications that were accepted from people not belonging to minority groups. Only applications from well qualified applicants are included in the analysis. (a) Does the acceptance rate appear to be higher for those belonging to minority groups or for those not belonging to minority groups ? Why?
The data in the table do not take into account the department of the company. The data shown in the next table show the number of applications accepted from each group within each department.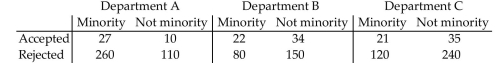
(b) Determine the proportion of minority applications that were accepted within department A. Determine the proportion of non-minority applications that were accepted within department A.
(c) Repeat part (b) for departments B and C to create a conditional distribution of acceptance rate by group for each department of the company.
(d) Write a short report detailing and explaining your findings.
Correct Answer:

Verified
(a) The acceptance rate appears to be hi...View Answer
Unlock this answer now
Get Access to more Verified Answers free of charge
Correct Answer:
Verified
View Answer
Unlock this answer now
Get Access to more Verified Answers free of charge
Q26: Compute the linear correlation coefficient between
Q27: Choose the one alternative that best
Q28: Choose the one alternative that best
Q30: Compute the Sum of Squared Residuals<br>-The
Q33: Choose the one alternative that best
Q35: Choose the one alternative that best
Q36: Interpret the Slope and the y-intercept
Q38: For a random sample of 100 American
Q46: A history instructor has given the same
Q60: A researcher determines that the linear correlation