Multiple Choice
The bar graph below shows the political party affiliation of 1000 registered U.S. voters. What percentage of the 1000 registered U.S. voters belonged to one of the traditional two parties (Democratic and Republican) 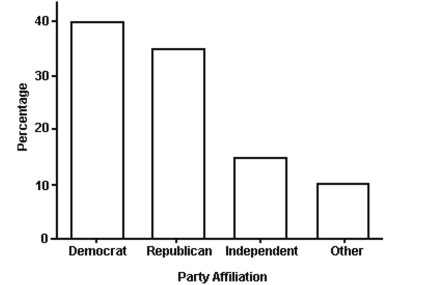
A)
B)
C)
D)
Correct Answer:

Verified
Correct Answer:
Verified
Q41: Describe What Can Make a Graph Misleading
Q42: The pie chart shows the percentage
Q43: Use the graph to answer the
Q44: Construct Histograms of Continuous Data<br>-A sample
Q45: Draw Time-Series Graphs<br>-Women were allowed to
Q47: The pie chart shows the percentage
Q48: Identify the Shape of a Distribution<br>-The
Q49: Draw Time-Series Graphs<br>-A transportation engineer wishes
Q50: Identify the Shape of a Distribution<br>-<img src="https://d2lvgg3v3hfg70.cloudfront.net/TB6005/.jpg"
Q51: Construct Histograms of Continuous Data<br>-The 30