Short Answer
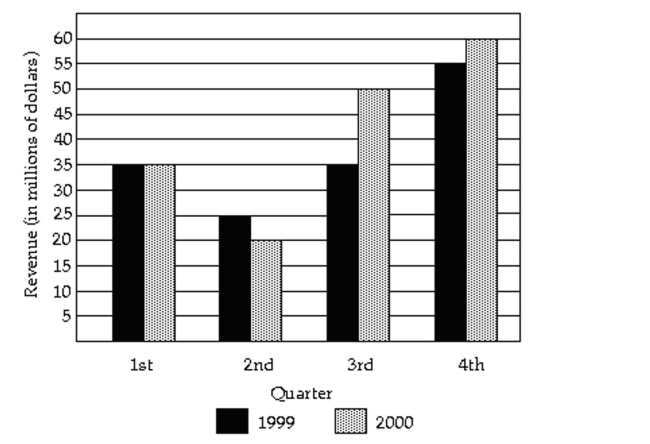
Use the graph to answer the question. 
-The grade point averages for 40 evening students are listed below. Construct a frequency bar graph and a relative frequency bar graph.
Correct Answer:

Verified
Correct Answer:
Verified
Related Questions
Q38: Identify the Shape of a Distribution<br>-<img src="https://d2lvgg3v3hfg70.cloudfront.net/TB6005/.jpg"
Q39: The pie chart shows the percentage
Q40: Create Cumulative Frequency and Relative Frequency
Q41: Describe What Can Make a Graph Misleading
Q42: The pie chart shows the percentage
Q44: Construct Histograms of Continuous Data<br>-A sample
Q45: Draw Time-Series Graphs<br>-Women were allowed to
Q46: The bar graph below shows the
Q47: The pie chart shows the percentage
Q48: Identify the Shape of a Distribution<br>-The