Multiple Choice
Use the graph to answer the question. 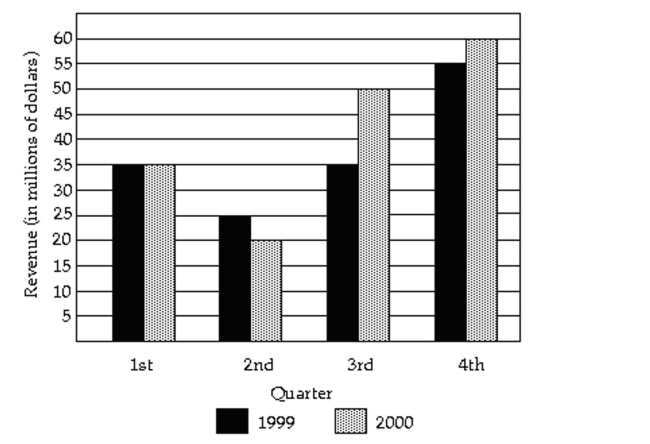
-In what quarter was the revenue the greatest for 2000
A) fourth quarter
B) first quarter
C) second quarter
D) third quarter
Correct Answer:

Verified
Correct Answer:
Verified
Related Questions
Q4: An ogive is a graph that represents
Q21: The pie chart shows the percentage
Q22: Create Cumulative Frequency and Relative Frequency
Q23: Create Cumulative Frequency and Relative Frequency
Q24: Relative frequency is the proportion (or
Q27: The pie chart shows the percentage of
Q29: The pie chart shows the percentage
Q30: The sum of all the relative frequencies
Q31: Construct Frequency Polygons<br>- <span class="ql-formula" data-value="\begin{array}
Q33: What is the difference between a bar