Multiple Choice
The pie chart shows the percentage of votes received by each candidate in the student council presidential election. Use
the pie chart to answer the question.
-Student Council President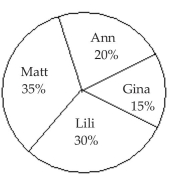
300 total votes Who got the fewest votes
A) Gina
B) Lili
C) Ann
D) Matt
Correct Answer:

Verified
Correct Answer:
Verified
Q4: An ogive is a graph that represents
Q22: Create Cumulative Frequency and Relative Frequency
Q23: Create Cumulative Frequency and Relative Frequency
Q24: Relative frequency is the proportion (or
Q26: Use the graph to answer the question.
Q29: The pie chart shows the percentage
Q30: The sum of all the relative frequencies
Q31: Construct Frequency Polygons<br>- <span class="ql-formula" data-value="\begin{array}
Q32: The pie chart shows the percentage
Q33: What is the difference between a bar