Short Answer
Use the graph to answer the question. 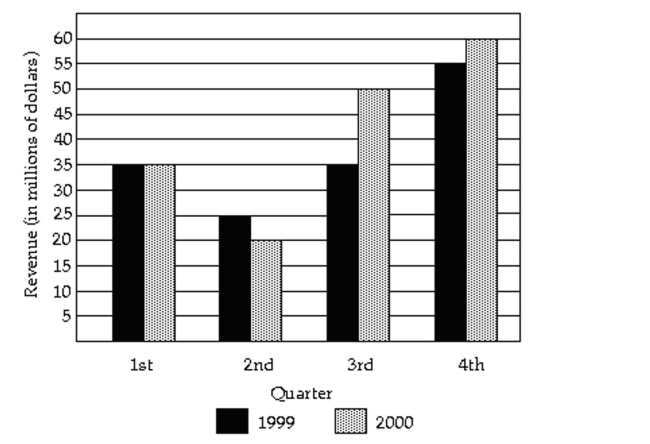
-The local police, using radar, checked the speeds (in mph) of 30 motorists in a construction area. The results are listed below. Construct a frequency bar graph and a relative frequency bar graph.
Correct Answer:

Verified
Correct Answer:
Verified
Q1: Identify the Shape of a Distribution<br>-
Q2: The pie chart shows the percentage of
Q3: Draw Stem-and-Leaf Plots<br>-The number of home
Q4: Create Cumulative Frequency and Relative Frequency
Q6: Draw Time-Series Graphs<br>-The data below represent
Q7: Draw Dot Plots<br>-The local police, using
Q8: Construct Frequency Polygons<br>-The local police, using
Q9: Identify the Shape of a Distribution<br>-The
Q10: Create Cumulative Frequency and Relative Frequency
Q11: Create Cumulative Frequency and Relative Frequency