Multiple Choice
The pie chart shows the percentage of votes received by each candidate in the student council presidential election. Use
the pie chart to answer the question.
-Student Council President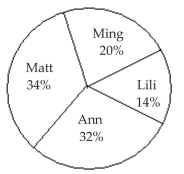
500 total votes What percent of the votes did Lili and Ming receive together
A) 34%
B) 66%
C) 14%
D) 20%
Correct Answer:

Verified
Correct Answer:
Verified
Q1: Identify the Shape of a Distribution<br>-
Q3: Draw Stem-and-Leaf Plots<br>-The number of home
Q4: Create Cumulative Frequency and Relative Frequency
Q5: Use the graph to answer the
Q6: Draw Time-Series Graphs<br>-The data below represent
Q7: Draw Dot Plots<br>-The local police, using
Q8: Construct Frequency Polygons<br>-The local police, using
Q9: Identify the Shape of a Distribution<br>-The
Q10: Create Cumulative Frequency and Relative Frequency
Q11: Create Cumulative Frequency and Relative Frequency