Short Answer
The pie chart shows the percentage of votes received by each candidate in the student council presidential election. Use
the pie chart to answer the question.
-A study was conducted to determine how people get jobs. Four hundred subjects were randomly selected and the results are listed below. Round percents to whole numbers. 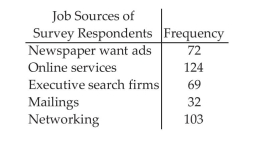
Correct Answer:

Verified
Correct Answer:
Verified
Q9: Identify the Shape of a Distribution<br>-The
Q10: Create Cumulative Frequency and Relative Frequency
Q11: Create Cumulative Frequency and Relative Frequency
Q12: The pie chart shows the percentage
Q13: The pie chart shows the percentage
Q15: The pie chart shows the percentage
Q16: Construct Histograms of Continuous Data<br>- <span
Q17: Use the graph to answer the question.
Q18: Create Cumulative Frequency and Relative Frequency
Q19: Create Cumulative Frequency and Relative Frequency