Multiple Choice
The figure shows the graphs of the cost and revenue functions for a company that manufactures and sells binoculars. Use the information in the figure to answer the question. 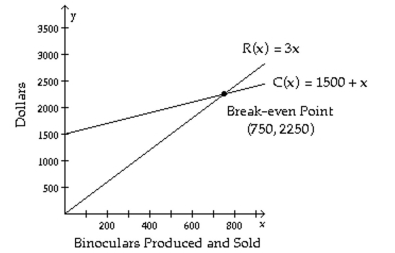
-Fewer than how many binoculars must be produced and sold for the company to have a profit loss?
A) 2250 binoculars
B) 750 binoculars
C) 1500 binoculars
D) 2700 binoculars
Correct Answer:

Verified
Correct Answer:
Verified
Q30: Solve the system by the addition
Q31: Determine whether the given ordered pair
Q32: Solve the system. If there is
Q33: Solve the problem.<br>-A flat rectangular piece of
Q34: Solve the problem.<br>-One number is 4 less
Q36: Solve the problem.<br>-Given the cost function,
Q37: Determine if the given ordered triple
Q38: Solve the system by the substitution
Q39: Solve the system by the substitution
Q40: Solve the problem.<br>-A bank teller has 53