Multiple Choice
The figure shows the graphs of the cost and revenue functions for a company that manufactures and sells binoculars. Use the information in the figure to answer the question. 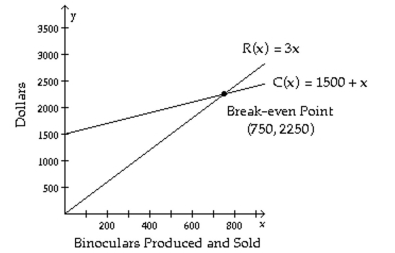
-Use the revenue and cost functions to write the profit function from producing and selling x binoculars.
A) P(x) = 4x + 1500
B) P(x) = 2x - 1500
C) P(x) = 4x - 1500
D) P(x) = 2x + 1500
Correct Answer:

Verified
Correct Answer:
Verified
Q48: Solve the system by the addition
Q49: The figure shows the graphs of the
Q50: Solve the system by the substitution
Q51: Solve the problem.<br>-Julie and Eric row their
Q52: Solve the system. If there is
Q54: Solve the problem.<br>-Given the cost function,
Q55: Determine if the given ordered triple
Q56: Solve the system by graphing.<br>-<img src="https://d2lvgg3v3hfg70.cloudfront.net/TB6471/.jpg"
Q57: Determine whether the system is inconsistent,
Q58: Solve the system by any method.<br>-