Multiple Choice
The figure shows the graphs of the cost and revenue functions for a company that manufactures and sells binoculars. Use the information in the figure to answer the question. 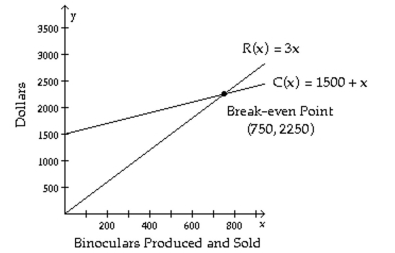
-At the break-even point both cost and revenue are what?
A) $750
B) $2250
C) $1500
D) $2700
Correct Answer:

Verified
Correct Answer:
Verified
Related Questions
Q44: Solve the problem.<br>-Jarod is having a
Q45: Solve the system by the addition
Q46: Solve the system. If there is
Q47: Solve the system by the addition
Q48: Solve the system by the addition
Q50: Solve the system by the substitution
Q51: Solve the problem.<br>-Julie and Eric row their
Q52: Solve the system. If there is
Q53: The figure shows the graphs of the
Q54: Solve the problem.<br>-Given the cost function,