Multiple Choice
The graph below shows the percentage of students enrolled in the College of Engineering at State University. Use the graph to answer the question. 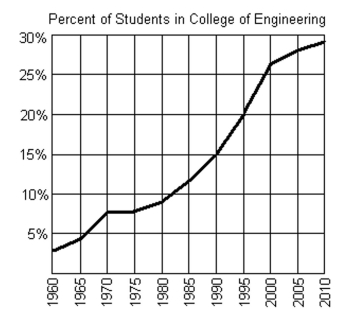
-Between what two years is the difference in function values equal to 5%?
A) between 1995 and 2000
B) between 1980 and 1985
C) between 1970 and 1975
D) between 1990 and 1995
Correct Answer:

Verified
Correct Answer:
Verified
Q101: Find the domain of the function.<br>-
Q102: Rewrite the given equation in slope-intercept form
Q103: Decide whether the relation is a
Q104: Use intercepts and a checkpoint to
Q105: Use the graph to find the indicated
Q107: Find the slope of the line
Q108: Graph the equation in the rectangular coordinate
Q109: Find the domain and range.<br>-{(41, -4), (5,
Q110: Use the graph to identify domain
Q111: Decide whether the relation is a