Essay
Which scatterplot below depicts a stronger linear relationship? Why? Explain what the scatterplot shows regarding a tree's volume. 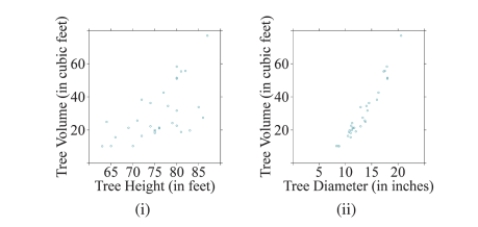
Correct Answer:

Verified
Scatterplot (ii) shows a stron...View Answer
Unlock this answer now
Get Access to more Verified Answers free of charge
Correct Answer:
Verified
View Answer
Unlock this answer now
Get Access to more Verified Answers free of charge
Q37: Use the following regression equation regarding professor
Q38: Use the following information to answer Questions
Q39: Use the following information to answer Questions
Q40: Use the following regression equation regarding airline
Q41: Which scatterplot below depicts a stronger linear
Q43: Use the following information for following questions
Q44: Suppose temperatures and monthly ice cream sales
Q45: Which of the following statements regarding the
Q46: Use the following information for following questions
Q47: Create a data set of 2 variables