Multiple Choice
Use the following information to answer Questions .
The scatterplot below shows the relationship between a car's speed and the distance it traveled to come
to a complete stop when hitting the brakes. The correlation coefficient between the values is 0.81. 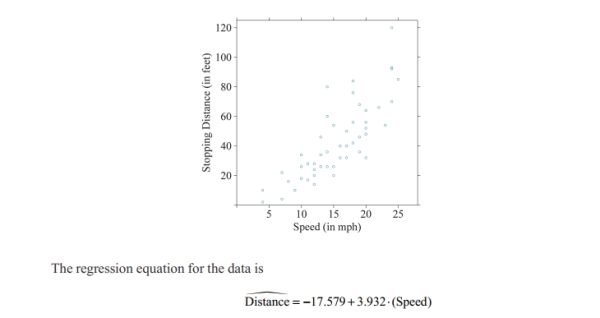
-Can we use the regression equation to predict the stopping distance of a car that is traveling at 40 mph?
A) No, we cannot make a prediction because a car that is traveling at 40 mph is outside the range of our data.We would be extrapolating.
B) No, we cannot make a prediction because the correlation coefficient does not equal 1.
C) Yes, we can always make predictions once we have a regression equation.
D) Yes, we can make a prediction because the scatterplot shows a strong positive linear relationship.
Correct Answer:

Verified
Correct Answer:
Verified
Q33: Suppose 50 married couples are asked to
Q34: Which of the following statements regarding the
Q35: Use the following information to answer Questions
Q36: Use the following information to answer Questions
Q37: Use the following regression equation regarding professor
Q39: Use the following information to answer Questions
Q40: Use the following regression equation regarding airline
Q41: Which scatterplot below depicts a stronger linear
Q42: Which scatterplot below depicts a stronger linear
Q43: Use the following information for following questions